Automated CAD Data Preparation.
Delivering Fast, Efficient XR Optimized Data
Theorem's Visualization Pipeline
The Visualization Pipeline is an Enterprise level fully automated solution which prepares XR data. It can be run in batch mode, processing data triggered by PLM processes, you can sit inside of CAD and do save as, or drag and drop from the file system. Whichever way you load data, the pipeline automatically tessellates the data and prepares it for XR. As well as processing (part files) geometry it retains product structure and metadata, including animation data, to further enrich the value of XR content.
Benefits in Brief
Fully Automated CAD Processing
Being fully automated it saves time and reduces cost by eliminating manual activity whilst maximising visualization performance and quality.
PLM Integration
Being an enterprise solution means it can be fully integrated into your PLM processes with minimal effort and cost. PLM integration means you have a fully managed solution for XR content creation, eliminating duplication of data and ensuring data conformance to IT policies.
User Authentication
It supports single sign on and user authentication to ensure workflows and data access are managed, ensuring control of data. Being process centric ensures consistent high quality data is created conforming to company standards.
Job Scheduling
Being able to schedule jobs means valuable computing resources are used to optimum effect, controlling costs.
User Defined Reporting
The Dashboard function allows you to view all metrics related to the server, this includes an overview of types of data uploaded, times of upload, size of files and many more data.
Fully automated optimization for XR
It includes fully automated processes to optimise the data for re-use; reducing polygons where necessary, shrink wrapping the data to remove non visible surfaces, eliminating unwanted data, or simplifying product structure to reduce data size. This ensures it provides high quality, high performance 3D content for XR. All processes are fully configurable and automated, there is no manual intervention required. The Visualization Pipeline can be installed on the Cloud or on premise and now supports Microsoft Azure Remote Rendering (ARR) for HoloLens 2 Mixed Reality devices enabling high-quality visualization of large datasets.
Why should I use the Visualization Pipeline?
New Extended Reality solutions and devices for delivering XR Experiences are evolving at a breathtaking pace. However, without content they deliver no value. The Visualization Pipeline addresses the requirement to create XR content.
Built using Theorem’s 30+ years experience in re-purposing CAD data for visualization, translation and publishing, the Visualization Pipeline is an enterprise ready solution for industrial companies and consumers of 3D data, to automate the process of creating XR content for visualization. As well as providing content for Theorem’s own XR Experiences it provides a solution for use by in-house development teams using Unity and Unreal.

Handles ANY 3D Data Type
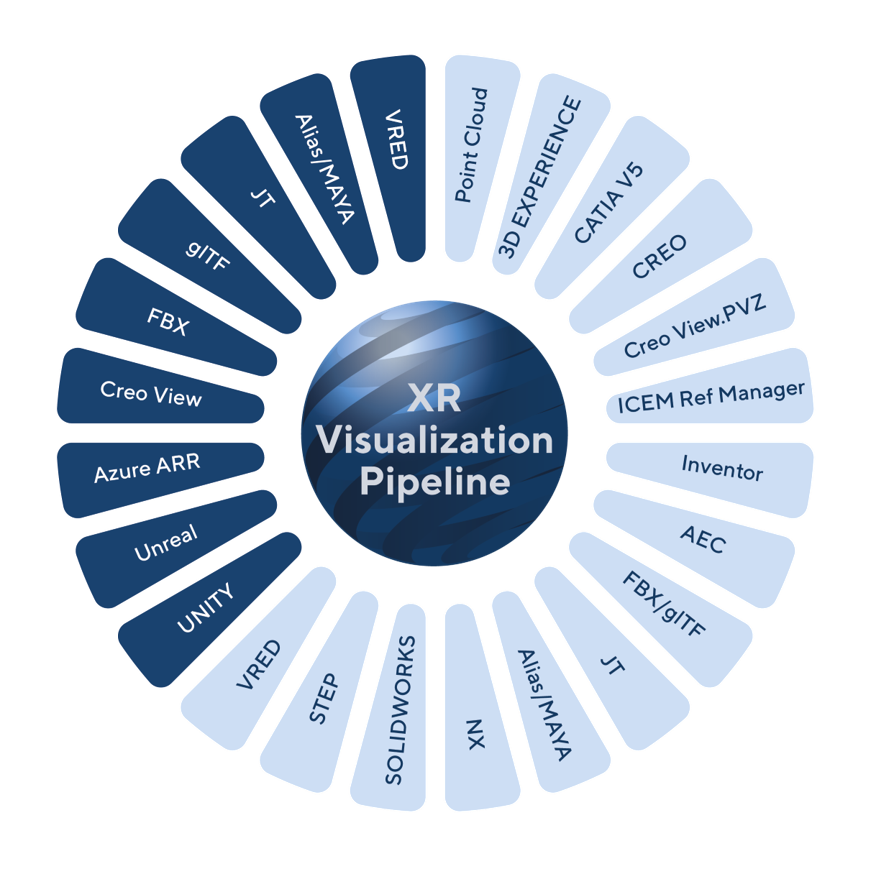
The Visualization Pipeline enables you to take source 3D data whether it’s from MCAD, AEC CAD, Scanned data, ISO/ANSI standard data like STEP and JT, lightweight visualization formats such as 3D XML and Creo View, and neutral formats such as FBX and glTF, and create 3D content in a fully automated process for use in XR experiences.
View the full list of supported formats into XR.
Being fully automated, it saves time and reduces cost by eliminating manual activity, whilst maximising visualization performance and quality.
Being an enterprise solution means it can be fully integrated into your PLM processes with minimal effort and cost. PLM integration means you have a fully managed solution for XR content creation, eliminating duplication of data and ensuring data conformance to IT policies.

Process Driven
It supports single sign-on and user authentication to ensure workflows and data access are managed, ensuring control of data. Being process centric ensures consistent high quality data is created conforming to company standards.
Being able to schedule jobs means valuable computing resources are used to optimum effect, controlling costs.
A full set of administration tools delivers management reports on usage, license allocation, data consumption and performance metrics. Enabling IT costs to be controlled and computing resources to be managed.

Engineering Focused Use Cases in XR
Visualization
Visualize 3D CAD data at full scale and in context and interrogate the data in Augmented, Mixed and Virtual Reality devices.
Design Review
Collaboratively review design milestones, at scale and in context. Make comments and annotate the design for later review.
Factory Layout
Individuals or groups of engineers can layout work cells, production lines or full factories using Mixed and/or Virtual Reality.
Visual Digital Twin
The Visual Digital Twin delivers a rich 3D digital model allowing it to be overlaid on top of a physical object and tracked. For use in inspection, training, packaging and in support of a full Digital twin.
Catchup on the latest TheoremXR news
Demonstration Request
Register now to request your free demonstration of the TheoremXR product suite.
In just a few simple steps, we will be able to validate your request based upon the details you provide.
Note: Please use your company email address for validation purposes as we will not respond to personal email accounts.
-
Complete all of your required details.
-
Let us know which TheoremXR product you are looking to learn more about.
-
If you have a specific use case that you would like to discuss then please let us know.
-
We will contact you to discuss suitable days and times and get everything setup.
-
Please only use your company email address for validation purposes as we will not respond to personal email accounts


